Your trading account is designed to help you buy and sell investments. While it shows you a bunch of metrics related to your portfolio, it might not reflect your actual returns or performance. This post explains the difference and shows you why tracking is arguably as important as trading itself.
As a dedicated portfolio performance tracking platform serving thousands of people, the team here at Navexa communicate with our community frequently.
One of the most common questions we receive from those just beginning their portfolio tracking journey with us, is this:
‘Why are the investment returns in my Navexa account different from those in my trading account?’
Many of our new members are accustomed to viewing their portfolio performance through a very different lens from the one Navexa provides.
That’s because the numbers you see when you log in to your trading account aren’t so much to do with portfolio performance as they are with nominal ‘gains’ or changes in value.
In a portfolio tracker, you’re seeing your rate of return, or growth rate, over time.
In this post, we’re going to explain the difference.
We’ll explain why, in our (biased) opinion, you won’t get a clear and complete picture of your long-term investment returns from checking your trading account alone.
We’ll explain how the figures you see differ both in their calculation and the information they reflect.
We’ll touch on the extent to which brokerage fees and commissions impact your portfolio performance — and why your trading account may not reflect that impact.
We’ll explain how an investment’s true performance differs from its gains, and share with you exactly how our portfolio tracking platform calculates that performance.
And, we’ll show you how to access our purpose-built portfolio performance tracking platform free today so you can see for yourself the difference from the numbers in your trading account.
Let’s start with the key differences between trading account numbers and those in a portfolio tracker.
Trading Accounts Are For Trading — Not Portfolio Performance Tracking
In our CommSec Review, you’ll learn my honest opinion about using Australia’s most popular trading platform.
As a trading platform, it’s great. But, as I argue in the review:
‘Having been in the market since 2013, and done my fair share of buying and selling, all I can see are two performance metrics: Today’s Change, and Total Profit/Loss.
‘To be blunt, that’s not enough for me.
‘Why?
‘Because portfolio performance is a lot more complex than just my total profit or today’s change.
I need to see lots more.’
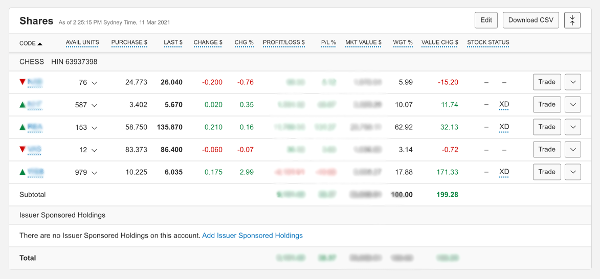
I can see today’s change in both dollar and percentage terms, my total profit/loss, my portfolio’s current market value, and the total cost (which, as you’ll see, isn’t actually my total cost).
Below this portfolio level information, there’s a holding-by-holding breakdown. This shows me the price I bought each investment at, the last price it traded for, the day’s percentage change and so forth.
Take a look:

That’s all the information available to about how my investments are progressing. Frankly, it’s not enough to satisfy my appetite for data on my journey to creating long-term wealth through investing.
Which is why I’m in favour of using a dedicated portfolio tracker.
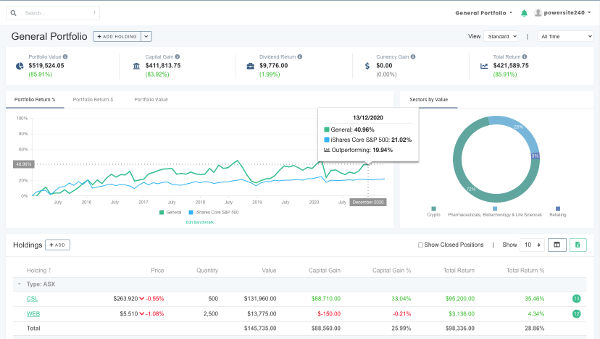
As I said, given that we operate one such tracker, this is obviously a biased opinion. But take a look at this screen compared with the one from my trading account:

That’s the Portfolio Performance Report in Navexa. Rather than providing just a handful of metrics about profit/loss and price changes, this screen shows four key metrics:
Total Return: In both dollar and percentage terms, the Navexa portfolio tracker shows me my portfolio’s actual, annualized return net of trading fees, income and currency gains (or losses).
Capital Gain: This shows me how much of my total return is comprised of capital gains across my investments. Again, this is annualized to reflect how long I’ve been running this portfolio (otherwise, my ‘gain’ would be the same regardless of whether it had taken me one year, or twenty, to achieve).
Dividend Return: This shows me how much of my annualized return over a given time period is down to my investments generating dividend income. In my CommSec account, for example, I can’t see my income factored into my portfolio performance.
Currency Gain: While not applicable in the example above, the reality of investing across multiple markets and currencies is that foreign exchange fluctuations impact a portfolio’s returns. A dedicated portfolio tracker, like Navexa, shows this.
You’ll also see, beneath the metrics I’ve just detailed, there’s another row showing the same numbers for IOZ, a leading ASX200 ETF.
This allows me to see at a glance how the portfolio is performing relative to the ASX200 across each of these factors. In the example, you’ll see that while the annualized return and capital gain is outperforming the benchmarked fund, it is lagging behind with respect to dividend income.
This is a valuable insight — and not one I can easily get by looking at my trading account.
In the holding list below, you can see the performance breakdown for each of the investments in the portfolio.
All the numbers you see reflect more than just the price movement of the investments. Here’s an example.
Fees & Commissions Impact Your Performance (But May Not Be Reflected In Your Brokerage Account)
My trading account doesn’t show me how fees are impacting my performance. That’s probably because I pay my broker to execute my trades for me. But consider this:
Let’s say I make 50 trades a year for 10 years at a cost of $20 a trade.
That’s $10,000. At the end of the 10 years, say I have 50 investments in the portfolio. When it’s time to sell out and collect the cash I’ve (hopefully) earned as the portfolio’s total value has appreciated over that time… that’s another $1,000 for all the sell trades on the 50 holdings at the end of the period.
The impact of fees? $11,000.
If the portfolio had started with $50,000, and we assume a 100% total return over the 10 years (that’s a 7.18% annualized return), the investor has, on paper, doubled their money.
Hooray! Right? Not quite.
You can see how this plays out in terms of actual portfolio performance.
For our purposes in this post, I hope you can see that trading fees play a major part in determining your true performance. Which is why you need to be able to easily see your returns net of that impact — as opposed to hidden away, as they are in many trading accounts.
Fees Aren’t The Only Factor: A Dedicated Portfolio Tracker Helps You Measure Everything Impacting Your Performance
While my CommSec account is, in my opinion, brilliant for conducting market and investment research (their tools and resources are second to none across Australian trading platforms), it’s severely limited in showing portfolio performance details.
When you really dive into the world of long-term wealth building, there are four factors that deeply affect your real returns.
Remember, I’m not talking about gains here. I’m talking about our net performance after every factor impacting a portfolio has been accounted for.
Here are the four factors:
Time: While it might be tempting to look at your overall returns going all the way back to the first day of a portfolio’s life, this can result in us misinterpreting our performance. My favourite illustration of this? Would you rather make a 500% return over one year, or 10? There’s a huge difference, and we all know it. Leaving time out of our portfolio performance calculations is straight up wilful blindness.
Trading Fees: As we lay out in detail, trading fees can and often do have a significant impact on portfolio performance. Looking at your tasty triple digit ‘gain’ in your trading account might feel nice, but when you add up the cost of all the buying and selling it’s taken to achieve that gain, the reality is probably not quite so glorious.
I have a friend who sold some crypto recently and, thanks to my incessant nagging about true performance, accepted that, while they’d made a healthy profit, they’d handed over a huge percentage in exchange and account fees.
Income: This one’s a counterbalance to time and trading fees. If I have a $100,000 portfolio that generates $10,000 in income every year, that’s a massive factor in my overall performance and returns. While my trading account only shows me my capital gains on an investment, my portfolio tracker shows me my total return including dividend income — and breaks down how much of my return constitutes income versus capital gains.
Taxation: Now this one’s a little different. But the reality is — especially for those of us investing with a view to financial independence or early retirement — we must pay a significant percentage of our profits to the government when we sell out of investments. This is important to consider when you’re assessing what you’ll gain from buying and selling stocks. It doesn’t impact your portfolio performance per se, but it does massively impact your financial outcome as you draw down or completely exit a portfolio.
(FYI: Navexa provides automated CGT and income tax obligation reports, plus an Unrealized Capital Gain report to help you assess and forecast your portfolio’s taxes.)
Currency gain is also important, but of course not all of us invest beyond our home markets. In Australia, in fact, the majority of investors doesn’t stray beyond the ASX, although this is gradually shifting as more services arrive to facilitate offshore investing through new platforms and apps.
Another point here is that Navexa’s portfolio performance calculation is money weighted. That means it accounts for inflows and outflows of cash in your portfolio. This is because the reality for many of us isn’t as simple as making an initial investment and leaving it alone. Rather, we buy and sell as we go.
A money weighted return is different from a time weighted return, which doesn’t account for cash inflows and outflows.

How Navexa Tracks Your Portfolio’s Performance With Automated Accuracy
When I set out to build Navexa, I just wanted a tool that would save me having to combine the data in my trading account with my own manual calculations in order to work out my true portfolio performance.
I — like many of the Navexa community — am a long-term, buy-and-hold investor to whom strong, annualized returns matter more than eye-grabbing one-off gains.
I’ve been learning about money and wealth creation for a long time. Everything I’ve learned has taught me it’s far better to work with hard data than skewed or incomplete information about a portfolio.
This is why the Navexa Portfolio Tracker, today, is one of the leading portfolio tracking platforms in Australia. We calculate annualized portfolio performance that accounts for all the factors I mention above.
Once you load your portfolio into Navexa, you start seeing true performance over the long term. You can see at a glance your capital gains, currency gains, investment income — all net of your trading fees.
You can run comprehensive tax reports with a couple of clicks. You can track & analyze more than 8,000 ASX & US-listed stocks and ETFs, plus cryptos, cash accounts and unlisted investments (like property).
And, you can go even deeper, running reports like Portfolio Contributions, which shows you in chart form which of your investments are boosting (and which are dragging down) your overall performance.
Like I said, I’m biased, since I started Navexa. But I wouldn’t have had to — and thousands of satisfied members wouldn’t be tracking with us — were it not for my trading account failing to provide a full and clear picture of my portfolio performance.
Trading accounts are for trading. Navexa is for portfolio tracking. If you’re doing the former, you should, IMHO be doing the latter, too.
Happy tracking — create an account here (zero obligation & no credit card required!).


