

Time-weighted return is one of the most popular ways of measuring investment performance and calculating returns. We explain how to calculate TWR and explore other key methods of tracking portfolio performance.
It can be challenging for investors to find the best method of measuring portfolio performance and investment returns. The time-weighted return is on of the most common ways of doing so.
Besides a simple rate of return, there’s the time-weighted return (TWR) method. It’s among the most common formulas used to track investment performance. In short, it accounts for moments when cash flows occur, and creates sub-periods to help investors track growth rates.
Keep reading to learn how bankers, investment professionals, and portfolio managers use a time-weighted rate of return to evaluate investment performance.
Impact of Inflows and Outflows of a Portfolio

Before diving into the time-weighted return, it’s crucial to understand cash flows. Cash flows are an important part of calculating portfolio performance. They also make a difference in which method experts use, because each performance calculation treats inflows and outflows differently.
Cash flows, or inflows and outflows, represent the total money transferred into and out of one’s portfolio — deposits and withdrawals. The example of inflows includes proceeds from the selling the asset. Outflows can be payments for buying a stock.
Cash flows can be used to define a sub-period, and the method that will be used to calculate the rate of return — the money-weighted rate of return, or time-weighted rate of return formulas.
If someone invested money and never made any withdrawals from their portfolio, calculating the rate of return on their investments would be easy. Any method would give the same result, since there were no outflows and inflows to observe across the sub-periods.
Still, this rarely happens in practice, and cash flows are always present. Investors may make changes in their portfolios daily, and calculating the weighted rate of return can be challenging. Since each method (TWR, RoR, MWRR) handles these cash flows differently, each will give a different performance number.
Here’s what you should know about the time-weighted return.
What Is the Time-Weighted Return?

Time-weighted return (TWR) is a method of measuring the compound growth rate of one’s portfolio. This method is designed to help investors eliminate the distorting effects of deposits and withdrawals.
TWR breaks up the investment performance into sub-periods, based on the moment when the money was added to, or taken out of, the account. Then, it provides the rate of return for each interval with cash flow changes.
Is Time-Weighted Return Correct?
By isolating the intervals based on these inflows and outflows, TWR provides more accurate numbers than simply subtracting the beginning balance from the final value of the portfolio.
Additionally, the time-weighted rate of return formula multiplies the returns for each sub-period, links them together, and shows how the returns have compounded.
The time-weighted rate assumes all gains are reinvested in the portfolio.
This method is also more commonly used by fund managers, or bankers, and not private investors. This is because fund managers usually don’t have control over cash flows, but still need some way to calculate portfolio performance and returns for their clients.
Can Time-Weighted Return Be Used to Compare Investments?
Some experts argue that TWR shouldn’t be used to compare investment performance, and that the money-weighted rate of return formula (equal to IRR) is a better measurement for comparison. This is mainly due to the complexity of its formula, which is not ideal for regular investors.
However, TWR remains preferred among fund managers and finance experts who don’t have control on the cash flows in the portfolios they manage.
Time-Weighted vs. Basic Rate of Return
The rate of return is one of the simplest ways of calculating the rate of return over a certain period. RoR is shown in percentage and represents the change from the beginning of the holding period until the end.
RoR is not always an accurate measurement, since it doesn’t account for cash flows. However, the time-weighted return calculation is there to eliminate the effect of cash flows, and create intervals based on when the money was added or withdrawn from one’s portfolio.
By isolating each time period, TWR provides more accurate results. In practice, the sub-periods between cash flow events are treated as constituent performance units, which are then combined to give the total performance for the overarching period.
However, there’s another method to compare it with.
Time-Weighted vs. Money-Weighted Rate of Return

Money-weighted rate of return (MWRR), which is equal to an internal rate of return (IRR) is another performance measurement method.
While the time-weighted method factors in the moment of change, creates the period for each change, and calculates period return, MWRR accounts for both the timing and sizes of cash outflows, such as:
- The cost of a purchased investment
- Withdrawals
- Reinvested dividends
It also accounts for inflows:
- Received dividends
- Deposits
- Sale proceeds
- Contributions
The key difference between TWR and MWRR is that MWRR doesn’t create time periods based on cash flows like the TWRR. This means that any cash flow within a time period can impact MWRR. If there’s no cash flow, both methods should provide similar results.
Money-weighted rate of return is a more complicated, but more accurate measurement of investment performance. This is also the most appropriate way to measure the return on investment.
The Importance of the Time-Weighted Return
Since the time-weighted return is based on cash flow, but used to calculate the period return for each interval, it’s usually used as a reflection of the investment strategy. Investors find it’s easier to calculate returns once the performance is broken down into sub-periods.
The TWR method helps them further isolate cash flows for each period and gain more accurate results. Plus, the TWR multiplies each sub-period, and shows how the returns compound over time.
This performance method is crucial for investment managers, since they don’t have control over cash flows in the portfolios they manage.
What Does the Time-Weighted Return Tell?
Since TWR is used to generate sub-periods and link them, it’s one of the best methods to see how the returns compound over time. When calculated correctly, TWR also shows the results of an investment strategy. It strips the impact of cash flows, and reveals pure investment performance.
How to Calculate Time-Weighted Return
Investors and fund managers who calculate time-weighted return start by calculating the rate of return for each sub-period. This is done by subtracting the ending balance from the initial value.
Then, they divide that difference by the initial value of the holding period.
The key is to create a new sub-period for each cash flow, and calculate the RoR for each of these.
Investors then add “1” to each of the return amounts. This simplifies the calculation of negative return numbers, and assures the formula works correctly.
Then, they multiply the rates of return for each sub-period, and subtract “1” to yield the time-weighted return.
TWR Formula
TWR = ((1+HP1) x (1+HP2) x (1+HPn)) – 1
TWR = Time-Weighted Return
HP = (End Value – (Beginning Value + Cash Flow)) / (Beginning Value + Cash Flow)
n = Number of Periods
HPn = Return for sub-period n
In addition to the basic TWR formula, two other calculations can clarify the portfolio performance — Simple and Modified Dietz methods.
Simple Dietz method
Since TWR doesn’t account for cash flows that likely occur during the holding period, the Simple Dietz method can be used to address this. This method assumes that cash flows occurred either at the beginning, middle, or the end of the measured periods (day, month, or year).
It compensates for external cash flows. The formula is:
R = B – A – C / A + C/2
R = rate of return,
A = beginning market value
B = ending market value
C = net external inflow during the period
Modified Dietz Method

There’s also the Modified Dietz method, which adjusts for cash flows daily. This method fits the Global Investment Performance Standards (GIPS).
The Modified Dietz method is also the most common way of calculating TWR. However, it’s not perfect, and may skew the results in certain circumstances.
Issues with timing
One of the main issues with calculating portfolio performance is the assumption that all transactions happen at the same time within each sub-period. If the sub-period is one day, we calculate the data as if all transactions happen at the beginning and end of the day.
This can lead to errors, as sometimes the change in the portfolio is equal to zero and we can’t apply some formulas. In such cases, experts would have to further adjust the Modified Dietz method for better results.
Issues with negative or zero capital
The average capital is usually positive. However, if a larger outflow occurs, the average capital could go to zero or become negative. This can cause the Modified Dietz calculations to show a negative balance when there’s an actual profit, and vice versa.
One of the solutions is to catch a moment when the outflow happens, account for it, and use the simple returns calculation for specific period returns.
Excel Sheet
Some fund managers like to use Excel to calculate the time-weighted return. They either download an existing template, or use formulas in the sheet.
Others create their own Excel sheet. They enter the portfolio data manually, starting with the beginning and ending values for each period. Then, they calculate the return for each of the sub-period.
To get to the TWR, experts should add 1 to each of the results (to mitigate the negative returns), use the geometric mean function, and finally subtract one at the end. Excel can then turn it into a percentage form.
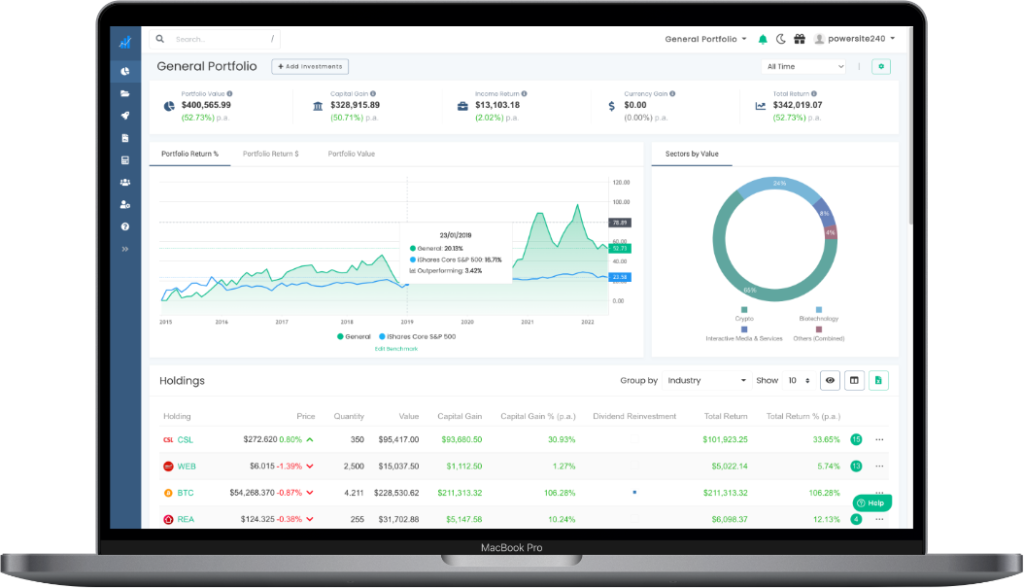
Automatically Calculating TWR With The Navexa Portfolio Tracker
If you’re looking for an easier way to get the accurate time-weighted return, the Navexa portfolio tracker uses a version of the Modified Dietz method. Our performance calculation accounts for the performance of assets, and the size, and frequency of cash flows for each sub-period.
This provides a clear idea actual investment performance. Simply upload the portfolio data you need to track, and Navexa will calculate the returns. Plus, the tracker will also annualize the numbers for an easier overview.
Navexa does so using live market data from the ASX, NASDAQ, NYSE and global cryptocurrency markets, displaying intra-day pricing and performance.
Advantages of the Time-Weighted Return
There are several advantages to the time-weighted return method. It:
- Is a solid indicator of investment performance,
- Eliminates the impact of cash flow,
- Provides a clear picture of returns after each deposit/withdrawal,
- Is suitable for measuring investment managers’ performance,
- Links periodic returns.
Disadvantages of the Time-Weighted Return
Due to the complex nature of investing, TWR still has some disadvantages. This calculation can turn out to be challenging when the money moves in and out of the portfolio more often. The common changes may skew the final number, and provide less accurate results.
Additionally, the TWR doesn’t measure how long the money has been invested, or when it was invested. This is why some investors may prefer IRR instead.
TWR is often used to track performance month over month. However, using the TWR is tricky if there’s an increased cash flow occurring within each month or day.
Examples of Using the Time-Weighted Return
The best way to understand how the time-weighted rate of return works is through an example. Let’s say that an investor has the portfolio of this value:
- Dec. 31, 2011 — $100,000
- Jan. 31, 2012 — $110,000
- Apr. 30, 2012 — $103,000
- Nov. 30, 2012 — $120,000
- Dec 31. 2012 — $135,000
This makes four time periods we should observe:
- Dec. 31, 2011 to Jan. 31 2012 (HP1)
- Jan. 31, 2012 to Apr. 30 2012 (HP2)
- Apr. 30, 2012 to Nov. 30, 2012 (HP3)
- Nov. 30, 2012 to Dec 31. 2012 (HP4)
Additionally, this person made a $12,000 withdrawal on March 3, 2012 (occurred during HP2) and a $20,000 deposit on December 20, 2012, (HP4).
Now we should calculate the holding period return for each period:
HP1 = 110,000- 100,000 / 100,000 = 0.100
HP2 = 103,000 – 110,000 + 12,000 / 110,000 = 0.0455
HP3 = 120,000 – 103,000 / 103,000 = 0.1650
HP4 = 135,000 – 120,000 – 20,000 / 120,000 = 0.0417
To get to time-weighted rate of return, we should now add 1 to each of the period results and multiply them together, then subtract one:
( (1 + 0.100) x (1 + 0.0455) x (1 + 0.1650) x (1 + 0.0417) ) – 1 = 0.2840
To get a percentage, multiply the result by 100, which equals 28.4%.
Summary: Time-Weighted Return Calculation
The time-weighted rate of return is a great method of measuring portfolio performance. It’s a preferred method among financial experts, bankers, and fund managers. The TWR formula focuses on time periods when cash flows occurred, and helps experts calculate growth for each period.
Time-weighted return is considered a standard in portfolio management, but still has some flaws. But by adjusting the calculation, fund managers and investors can overcome these issues, and measure growth correctly.
A money-weighted return, on the other hand, measures compound growth in the value of all funds invested in a portfolio over the evaluation period.
Navexa is one of the easiest tools to use for understanding your returns and portfolio performance. Our advanced performance calculation utilizes the Modified Dietz method.
Not only that, but when you track your performance in Navexa, you can examine performance at both the portfolio and individual investment level, and toggle between simple and compound returns in a single click.


