
Level 2, or level II, market data refers to real-time access to an additional layer of information about the market’s depth and momentum. If you’re a trader, or you’d simply like to learn more about level 2 market data, this post explains how it works, how to interpret it, and demonstrates level 2 market data in action.
Imagine knowing how many traders were placing orders in a stock before those orders were fulfilled. Imagine knowing the sizes of those orders, the speed at which buyers found sellers for them, and the prices of not only the highest and lowest buy or sell order, but the prices of 10 or more at any given time.
In other words, imagine having a lens through which you could see a stock’s liquidity, supply and demand in real time, before the rest of the market found out.
Welcome to the world of level 2 market data.
Level 2 market data is the realm of the trader. That’s because the information it provides gives the traders a clearer picture of a stock’s supply at demand and a variety of price levels.
This post is going to walk you through why this data exists, how to read the information on a level 2 quote screen and the reasons you might want to.
We’ll also show you a couple of examples of level 2 quote screens and share some tips on reading and interpreting them.
Plus, we’ll share some great resources where you can find out more, and introduce our powerful online tool we recommend using to track, analyze and report on your trades and portfolio, regardless of whether you’re a buy-and-hold investor or an active trader using level 2 data to research stocks.
Before we continue, an important note: This post is not intended to be financial or investment advice. It is general information only and we recommend that you do your own research and/or seek professional advice before risking your money on an investment — regardless of whether you use level 1 or level 2 data!
Now, let’s get into it.
What Is Level 2 Market Data?
To understand level 2, or level II market data, first let’s look at level 1.
The more basic of the two types, level 1 market data generally provides the following information;
- Bid price: The highest price a buyer is willing to pay.
- Bid size: The amount traders are looking to buy at the bid price.
- Ask price: The lowest price a seller will sell for.
- Ask size: The amount traders are looking to sell at the ask price.
- Last price: The price of the most recent trade.
- Last size: The amount of shares that most recent trade was for.
This level 1 data provides plenty of intel for most traders — particularly those using trading strategies based on price action — to make decisions around what, and when, they’re going to buy or sell.
You can think of level II market data as an expanded version of level I.
With level 1, the bid price and ask price information refers only to the highest and lowest prices, respectively. But with level II market data, you’ll see multiple high bid prices — five, 10 or more, depending on the exchange you’ve bought the data feed from.
It’s the information on the bid and ask prices that sets this data apart.
Similarly, you’ll see multiple bid and ask sizes related to those prices.
In other words, level 1 shows you only the extremes of a stock’s trading behaviour — the upper and lower levels at which traders are buying and selling, plus the quantities.
Level II gives traders a clearer picture of what’s going on with a stock because they can see a larger chunk of the trading action — more trade prices and sizes, and more importantly, more information on the difference between what’s happening at the upper and lower prices of current trading activity.
Sometimes you’ll hear level II market data referred to as ‘the order book’. That’s because you won’t just see orders that have been filled already, but also orders that have been places and are yet to be filled.
This is another layer of insight in that you can watch how long a given order takes to be filled. In other words, how long the market takes to pounce on a buy or sell order at a given price.
- TL;DR: Level 2 market data shows you more of the buying and selling action than the more commonly used level 1 data — including orders that haven’t yet been filled.
Intelligent Portfolio Performance Tracking
Track Australian & US trades, cryptos, cash accounts, currency gain, dividend income and more with the Navexa Portfolio Tracker.

How To Read The Information On A Level 2 Quote Screen
So now you know what sort of information level 2 market data shows. What about how you’re supposed to interpret that information in your stock analysis and trading?
There are four key insights you can gain through the information in a level 2 quote.
They are: Market depth, liquidity, timing and bid-offer spread.
Market depth expresses the measure of supply and demand for the stock. By checking the quantity of the open buy and sell orders, you can get an idea of how ‘deep’ the market for this particular stock might be.
Liquidity is closely related to market depth. It’s the measure of total buys and sells and, crucially, how fast those orders are fulfilled and replaced by fresh ones.
The level 2 market data can help traders looking to time their buying and selling by revealing a stock’s market depth and liquidity. If you can see there’s plenty of buyers and sellers placing and fulfilling orders at a fast pace, you can decide when might be the best time to make your own trade.
The bid-offer spread is the difference between the price you can sell the stock and the price you can buy it (the bid and ask prices).
The difference between these prices (and remember, in level 2 market data, can see more than just the highest and lowest prices) is known as the spread. Generally speaking, the smaller a stock’s spread, the more liquid you’d consider it.
- TL;DR: Level 2 quotes show you a stock’s depth, liquidity and bid-offer spread.
Why Do I Need To Know How To Read Level II Market Data?
Strictly speaking, you don’t need to know how to read level II market data to trade stocks. As we mentioned, this type of data is an additional layer on top of the level 1 market data most everyday traders have access to on their trading platforms.
It’s not essential to have access, or to know how to interpret it in order to invest and trade.
But if you’re an active or advanced trader, using a trading strategy that hinges on intra-day data — or that requires leverage (borrowing money) — you may find that the additional information in level 2 market data benefits you.
This is particularly true if you find additional data on bid and ask prices useful, or if you want to get an idea of who the market makers are for a stock (more on market makers below).
If, for example, you’re trading with a few thousand dollars as a hobby, you might not benefit from seeing level 2 quotes for stocks you’re interested in.
But, if you’re looking to deploy, say, $500,000 into the market with the objective of making quick profits from small price movements, then level 2 market data might help you get an edge in your trading.
- TL;DR: If you’re trading frequently and/or with leverage, having access to this additional layer of information about a stock’s price action may be valuable.
Example Of Reading A Level II Quote Screens
Here’s an example of a level 2 market data quote screen:
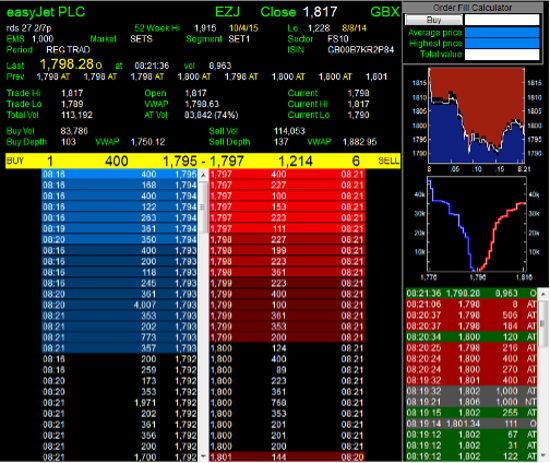
At first glance, this might look like a confusing collection of raw numbers.
Let’s break it down. The top section shows you an array of information about the stock this quote is for — easyJet.
You can see the ticker symbol, the latest closing price, and a selection of current information like the last price shares changed hands for.
In the top section you can also see ‘buy depth’ and ‘sell depth’. These numbers refer to the liquidity on both the demand and supply side of the current trading.
Below that, you can see two tables containing the latest buy and sell orders. These tables are mirrored, so the outside column of each shows you the time of the order, the middle column shows the quantity and the inside column the price of the order.
Tips For Using Level 2 Quotes
Using level 2 market data in your trading means you get access to a wealth of additional, real-time information about the market for a particular stock. You’ll be able to make more accurate judgments of liquidity and order sizes on both the buy and sell side.
But, one thing to be aware of with this type of data is that things aren’t always what they seem.
Key to this is the types of market participants you’ll see in a level II quote.
There are three types of market participants you might see in a level 2 quote. They are the market maker (the market maker is the one who dominates the price action, doing the most buying and selling), electronic communication networks or ECNs (the order placement systems through which people place their trades), and wholesalers (some online brokers and platforms sell their orders to a wholesaler who executes orders for them).
Market makers will sometimes hide their order sizes so as not to tip off the market about their appetite for a stock. Rather than placing one large order, market makers might place several small ones — or trade through an ECN so that you can’t see who’s behind the order.
Trading Stocks? Track Them With Navexa
Import your portfolio in seconds. Track your investment performance. Automate your tax reporting & more.
Resources For Learning More About Level 2 Quotes
The world of level 2 data is more complex than the more widely used market data and stock analysis you might be used to.
To learn more about how the information in a level 2 quote might be indicative of future price action, here’s a few resources worth checking out:
- This great infographic
- This explanation of level 2
- This introduction to reading level 2 quotes
- This article on market depth
Analyzing a stock using level 2 data could give you insights into liquidity, bid and ask prices, and spread, which may be indicative of trend changes.
If you’re going to go so far as to subscribe to level 2 data, there’s something else you should make sure of, too.
Whether you’re using level 2 quotes to analyze stocks you’re considering trading, or you’d prefer to buy undervalued companies and hold them ‘forever’ like the great Warren Buffet, you must ensure you correctly track your investment portfolio performance.
Also Check Out: How To Use The Zig Zag Indicator To Read Charts
Understanding a stock’s trend is a vital part of trading, and a key focus for technical analysis.
The zig zag indicator is a basic technical analysis tool you can use to determine whether a stock is trending up or down.
This indicator is one of the more simple tools used in technical analysis — the discipline of analyzing charts to make predictions on future price movements.
Discover the zig zag indicator formula is and the basics of how to calculate and use it in your investment analysis.
How The Navexa Portfolio Tracker Helps You Track, Analyze & Understand the Stocks, ETFs and Cryptos In Your Portfolio
Here at Navexa, we’re in the business of creating tools to help self-directed investors better understand their investment portfolio.
Regardless of whether you’re a long-term, buy-and-hold investor who prefers ETFs to stock picking, or you’re an active trader using a specific system to chase profits on a weekly or daily basis, Navexa’s portfolio tracker is designed to track your true performance.
When we invest and trade, we often just focus on stock prices and returns.
But the fact is that there’s many more factors that impact how much money we actually make, or lose.
This is why we’re created a platform that accounts not just for annualization (your average annual return over the whole time you’ve held an investment), but also for trading fees and income (two commonly overlooked but very important factors we sometimes leave out when we analyze our portfolio performance).
Trading and investing properly requires that you properly track and understand the impact of your trades and investments over the long term, in real money terms.
That’s why you need to portfolio tracker that calculates your true performance for your portfolio and the holdings in it.
True performance is different from the simple ‘gain’ you’ll see in your trading account.
It accounts for how long you’ve held a position, trading fees, currency gain and dividend income.
The portfolio tracker we run here at Navexa does all this (plus, you can generate a variety of reports, from diversification to portfolio contributions, and many more).
You can track ASX, NYSE and NASDAQ-listed stocks and ETFs, plus cryptocurrencies using official exchange data.
Try Navexa free today and see for yourself what your portfolio’s true performance really is.


